City of Toronto · all 25 wards · 540,801 door-to-door addresses
The Future of Canada Post in TorontoMailboxes, fewer letter days, and who pays
I like Canada Post. Today I can walk to a post office in Toronto, and I hope I still can in ten years. But the future of Canada Post looks uncertain, and its plan to end door-to-door delivery for 540,801 Toronto addresses is going to be harder than the announcement makes it sound.
I worked on the original community mailbox roll-out with Hill+Knowlton Strategies around 2014, and I know this won't be easy. Every box needs a site, and somebody has to clear the snow around it and walk to it. Community mailboxes don't make the cost of delivery go away. They move part of it from Canada Post onto the City, onto households and onto the sidewalks and boulevards we all share. So does Canada Post save enough to make that worth it?
Letters aren't coming back. In 2006 a Canadian household got seven a week. By 2025 it got two. Canada Post lost $1.57 billion before tax last year, and it looks set to cost Canadians a billion dollars or more a year for years unless something else changes. There is another option for Toronto: keep the carrier coming to the door every day for parcels, and bring letters less often. This assessment asks which works better for Canada Post, for the City and for the people who live here.
Letters are disappearing
Letters per household per week, 2006 to 2040
At this rate a household gets about 0.7 letters a week by 2040. That is one letter every seven visits under today's five-day delivery, and less than one per visit even with weekly delivery. Whatever service is lost by bringing letters less often gets smaller every year.
Parcels: the business to win back
Canada Post's parcel market share
Parcels are where the growth is, and about half of Canada Post's revenue. Gig delivery services and global couriers took most of the market while Canada Post was on strike.
The options
Four ways to deliver to Toronto
Canada Post's value over 15 years against today's service, for 540,801 door-to-door addresses.
Three ledgers
Who gains and who pays?
Canada Post's books are only part of the picture. Mailboxes move part of the cost of delivery onto the City and onto households.
Siting
Finding room for the boxes
The model places sites on City open data under Canada Post's own rules, including the 9 m corner setback, and gives each household a box within a 250 m walk. Then it checks the result on the street.
Obstructions, lack of space and driveways that City data doesn't show.
Hardest wards
Most households without a site| Ward | Households | Sites | No site |
|---|
15 years
Value to Toronto, by who pays
Present value over 15 years against today's service. Right of the line is a gain, left is a cost.
Keep the carrier at the door, and bring letters less often
Mailboxes save Canada Post money, but less than cutting letter days, and they hand part of the bill to the City and to the people who live here.
The detail
How the numbers work
The rest of the page shows the working behind each figure above: the return on investment, the walk, the trends, the break-even test, the ward map and what Canada Post costs Canada.
Return on investment for Canada Post
Start with Canada Post's own books. Here is what each option costs up front, what it saves each year once it is fully running, and what it is worth over 15 years.
| Toronto, Canada Post | A: mailboxes | B: alternate-day | C: weekly |
|---|
Mailboxes save the most each year, but they cost the most to set up. Conversion needs about $345 per address across the city up front ($375 for each address actually converted), plus upkeep on every site every year. It takes about ten years to pay back, which leaves it with the smallest 15-year value of the three. Even after 40 years it still trails alternate-day letters at central values, partly because the boxes need replacing at year 20.
Fewer letter days cost almost nothing to set up. The only up-front cost is an assumed $20 per address for re-routing and notices, which is why the return per dollar looks so high. Their yearly savings are assumed too, so the 15-year value and the break-even test further down make the fairer comparison.
Who gains and who pays, ward by ward
Canada Post's books are only part of the picture. Conversion takes work off the carrier's route and hands some of it to the City and to residents. This chart shows each option's value against today's service over 15 years, split by who bears it. Positive is a net benefit.
What the walk to the mailbox costs
Under conversion, the last few metres of delivery become the household's job. The household and public-space cost is built from three parts: the time spent walking, the health benefit of that walk, and the public boulevard the pads take up. Citywide central values:
| Per converted household, each year | Value | Where it comes from |
|---|
| Toronto, all converted households | Each year | Over 15 years |
|---|
The health benefit decides how big this cost is
Metrolinx values the health gain of new walking, mostly trips that replace driving. Whether a walk to the mailbox counts as new exercise is an open question. Some households will drive. Some will fold it into walks they already take. For frail residents the walk may be a hazard. The central case counts the full Metrolinx value, which is the most favourable assumption for conversion. Take the health benefit away and the 15-year household and public-space cost rises from to . Across all simulations the median is .
Older residents feel this most: 79% of people in Canada Post's accommodation program are over 75. Even with the full health benefit counted, conversion beats today's service across all ledgers only if an hour of walking time is worth less than , against Metrolinx's $21.79.
Rising labour costs and falling mail
None of this plays out in a steady world. Two trends run through the whole 15 years, and both are built into every figure on this page.
Labour keeps getting more expensive. Labour and benefits are 67.4% of Canada Post's operating costs. The 2026 CUPW agreements tie wages to inflation until January 2029. After that, the model assumes postal labour costs rise 1% a year above inflation, so every carrier hour saved is worth a little more each year.
Letters keep disappearing. Households received 7 letters a week in 2006 and 2 in 2025, a fall of 6.4% a year. The 2025 Industrial Inquiry Commission called the decline irreversible: "not a levelling off, but almost certain and eventual extinction." As letters fall, Canada Post consolidates routes, so some of the letter delivery each option would save is going away on its own. The model assumes the letter part of route cost per address falls 1.9% a year.
| Toronto, Canada Post, 15 years | A: mailboxes | B: alternate-day | C: weekly |
|---|
Together, the trends lower every option by 11 to 14% and leave the order unchanged. Falling mail cuts all three, because each one saves letter delivery that is disappearing anyway. Rising labour costs help mailboxes most, since they save the most each year. At 2% a year instead of 1%, mailboxes pass alternate-day letters somewhere between years 30 and 40, and still stay well behind weekly letters.
Today's service isn't a stable baseline either. Five-day letter delivery to the door is the yardstick here, but at these volumes it is unlikely to last. Mailboxes and fewer letter days are two answers to the same decline. The real question is which one costs less and pushes less onto the City and households.
What fewer letter days must save
So the comparison turns on one unknown: how much Canada Post saves by delivering letters less often. To beat mailboxes, fewer letter days must save more than a threshold per address for each letter-delivery day removed. Canada Post hasn't published an estimate, so the dots show what other postal services found. The ones that carry letters and parcels on the same routes, as Canada Post does, sit well above the thresholds.
CAD (2025) per address per year, for each weekly letter-delivery day removed. Vertical lines are the Toronto break-even thresholds; hover a dot for its source.
Where mailboxes could go
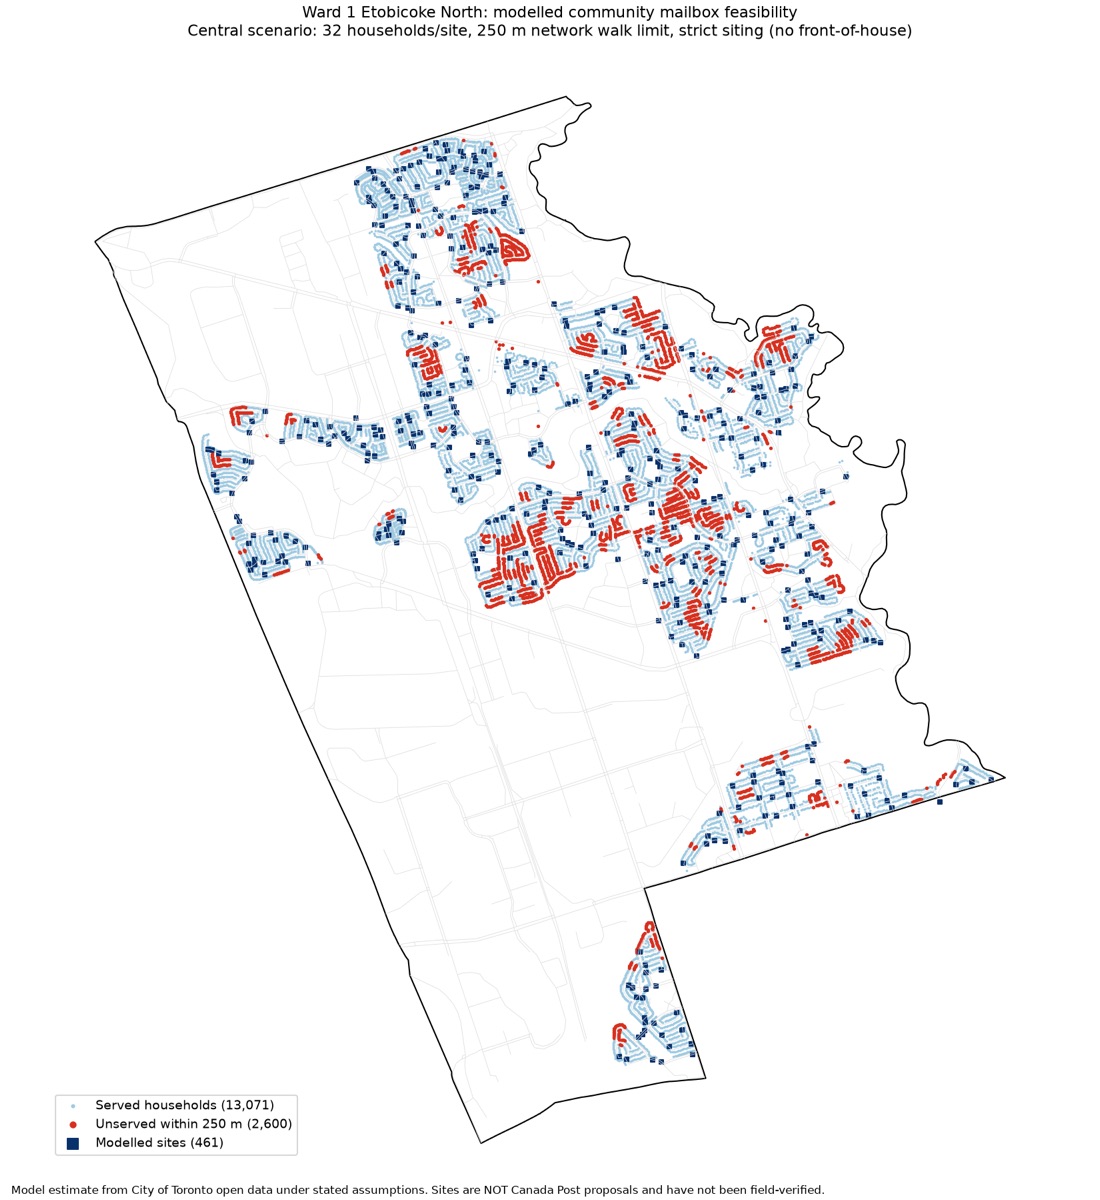
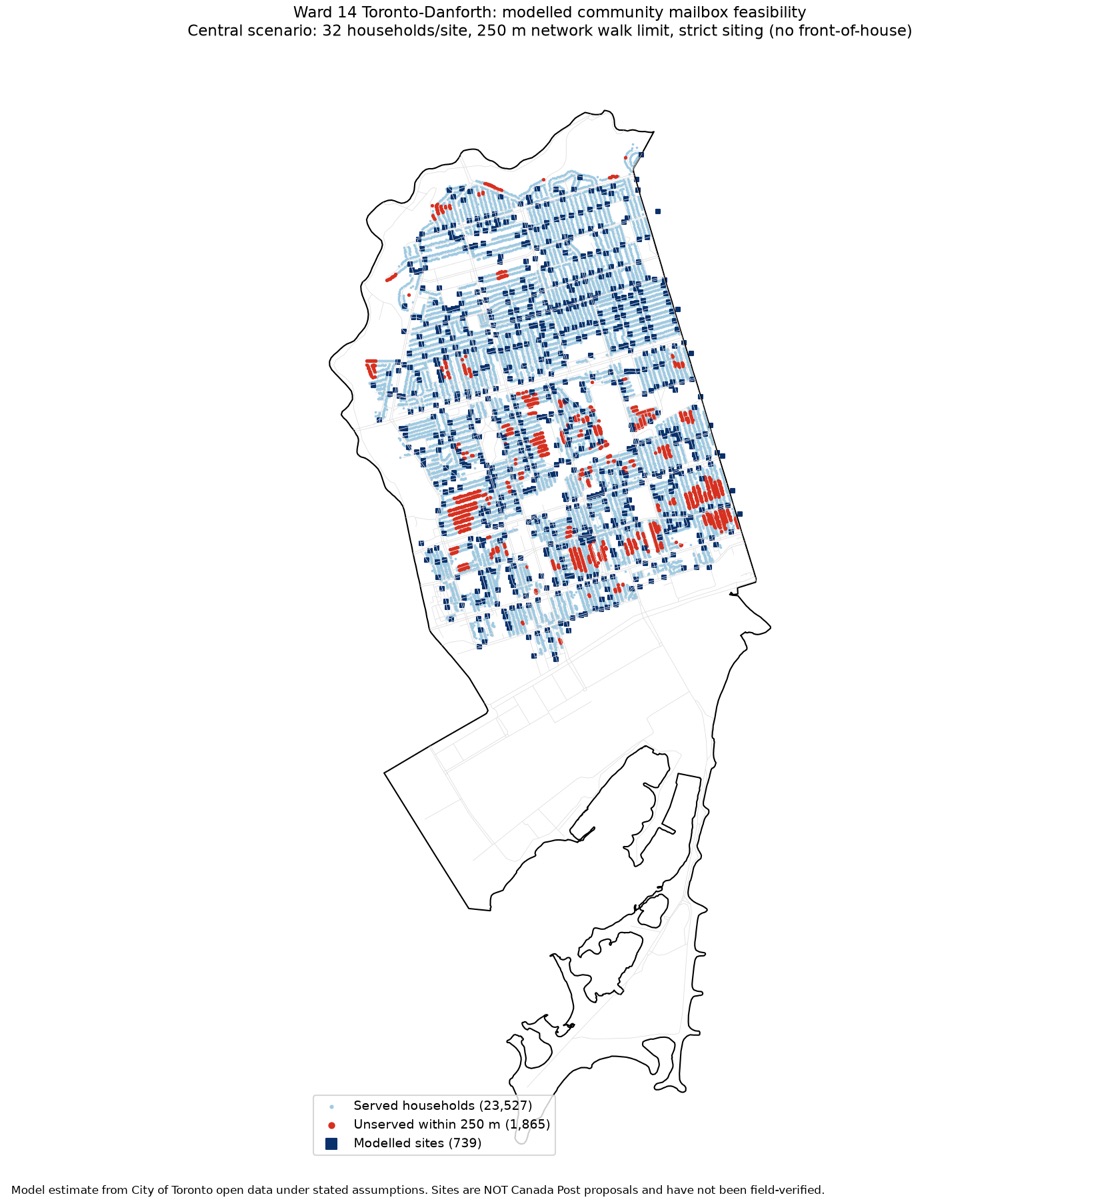
Conversion also depends on finding somewhere to put the boxes. Using 24 City of Toronto open datasets, the model places candidate sites that follow Canada Post's published rules, including the 9 m corner setback, and assigns each household to a site within a 250 m walk. It ran separately in all 25 wards. Canada Post says it avoids putting boxes in front of houses. Applied strictly, that rule leaves some households with no acceptable site at all.
Households with no acceptable site within 250 m
The post-war suburban wards in Etobicoke and Scarborough are the hardest. They hold of modelled addresses but of the households left without a site. Hover a ward for its figures.
All 25 wards
| Ward | Addresses modelled | Sites | No acceptable site | Median walk |
|---|
The Street View check
To see how the model holds up on the street, a random sample of 50 modelled Ward 1 sites was checked in Street View. 60% were feasible as modelled, and 66% with minor work (95% intervals 48 to 72% and 54 to 78%). Most failures came down to obstructions, lack of space, and driveways that City data doesn't show. This was one quick pass by one reviewer, so treat the rates as indicative.
What Canada Post costs Canada
Step back from Toronto and a much bigger problem comes into view. Canada Post has lost money every year since 2018, and since 2025 the federal government has been lending it the cash to keep operating. Whichever way Toronto's door delivery goes, the national bill is far larger.
Canada Post calls the loans repayable. The Industrial Inquiry Commission was blunter: repaying the first one "requires the complete suspension of disbelief." Canada Post says it will need more government money until its transformation pays off.
To see what the options here are worth nationally, this projection extends Canada Post's own no-reform forecast to 2040 and applies each option to the roughly four million door-to-door addresses left in Canada, using Toronto's per-address results.
Canada Post's yearly loss, no reforms and with each option
2025 dollars, before tax. Central path: Canada Post's forecast of about $200M more loss each year to 2029, slowing afterwards as letter revenue runs out. Low: flat at $1B. High: $200M more every year. Mailboxes add to the loss until 2031 while the boxes go in over five years. Hover for each year.
| Canada, 2026 to 2040 | Total | Discounted at 7% | Yearly once running | 2040 loss closed |
|---|
No delivery option comes close to closing the gap. With no reforms, Canada Post loses about from 2026 to 2040 on the central path ( across the range), and the yearly loss reaches about by 2040. Each option closes 3 to 11% of it. Mailboxes also push about onto cities, households and public space, which is roughly what they save Canada Post.
The real levers are elsewhere. The loss comes from letter revenue falling faster than costs can be cut, while wages rise and more than 200,000 new addresses are added every year. What decides the bill is the labour model in the new agreements, retirements, letter prices and service standards, the post office network and, above all, whether Canada Post can win back parcels.
Parcels: the growth business Canada Post lost
Parcels were supposed to replace letters. Canadian ecommerce is expected to double over the next decade, and parcels made up half of Canada Post's revenue in 2023. But Canada Post's parcel volume is now less than half of its pandemic peak. Its share of the parcel market fell from 62% in 2019 to 29% in 2023 as gig delivery services and global couriers moved in, many delivering seven days a week. Strikes in 2024 and 2025 sent more customers away, and parcel volume fell 32.6% in 2025 alone.
Canada Post parcel volume, 2019 = 100
Built by chaining the yearly volume changes in Canada Post's annual reports, so it is approximate. The 2020 change is for domestic parcels only.
2026 shows the first recovery, from a low base. Parcel volume was down 17.2% in the first quarter and up 15.6% in the second, with parcel revenue up 20.7%. Both comparisons are against strike-hit 2025, so the business is growing again but is still far below where it was.
Toronto is at the centre of it. Canada Post says most of Canada's parcels start in the Greater Toronto Area. Its $470 million Albert Jackson Processing Centre in Scarborough opened in 2023, can sort more than a million parcels a day and doubled its GTA capacity. Canada Post hopes to launch weekend delivery in Toronto, Montréal and Ottawa in late 2026. It does not publish parcel volumes for Toronto.
Why this matters for the options here. Alternate-day and weekly letters keep a carrier at the door every day for parcels, which is where Canada Post's growth has to come from. Canada Post's own plan instead co-delivers small packets with mail at community mailboxes, with larger parcels still going to the door.
What this cannot yet say
- Canada Post's real savings. The saving from conversion in Toronto and the saving from fewer letter days with daily parcels are both assumed. A Canada Post estimate of either would narrow every result here.
- Site feasibility. The Street View check covers one ward in one quick pass, and every ward uses its failure rates. The replacement simulation treats failures as independent; if they cluster by street, coverage is worse than shown.
- The address count. The model finds 423,227 low-rise addresses against Canada Post's 540,801. They agree in Ward 1; citywide, the gap is most likely units in converted houses and small walk-ups. The money figures use Canada Post's count.
- The national projection. It scales Toronto's per-address results to about four million door-to-door addresses and extends Canada Post's own forecast, made before the 2024 strike and the new agreements. The path of losses is the largest uncertainty, and an accounting loss is not exactly the cash the government must provide.
- Left out. Mail delay under B and C, driving trips to the boxes, ice injuries and theft are not valued.