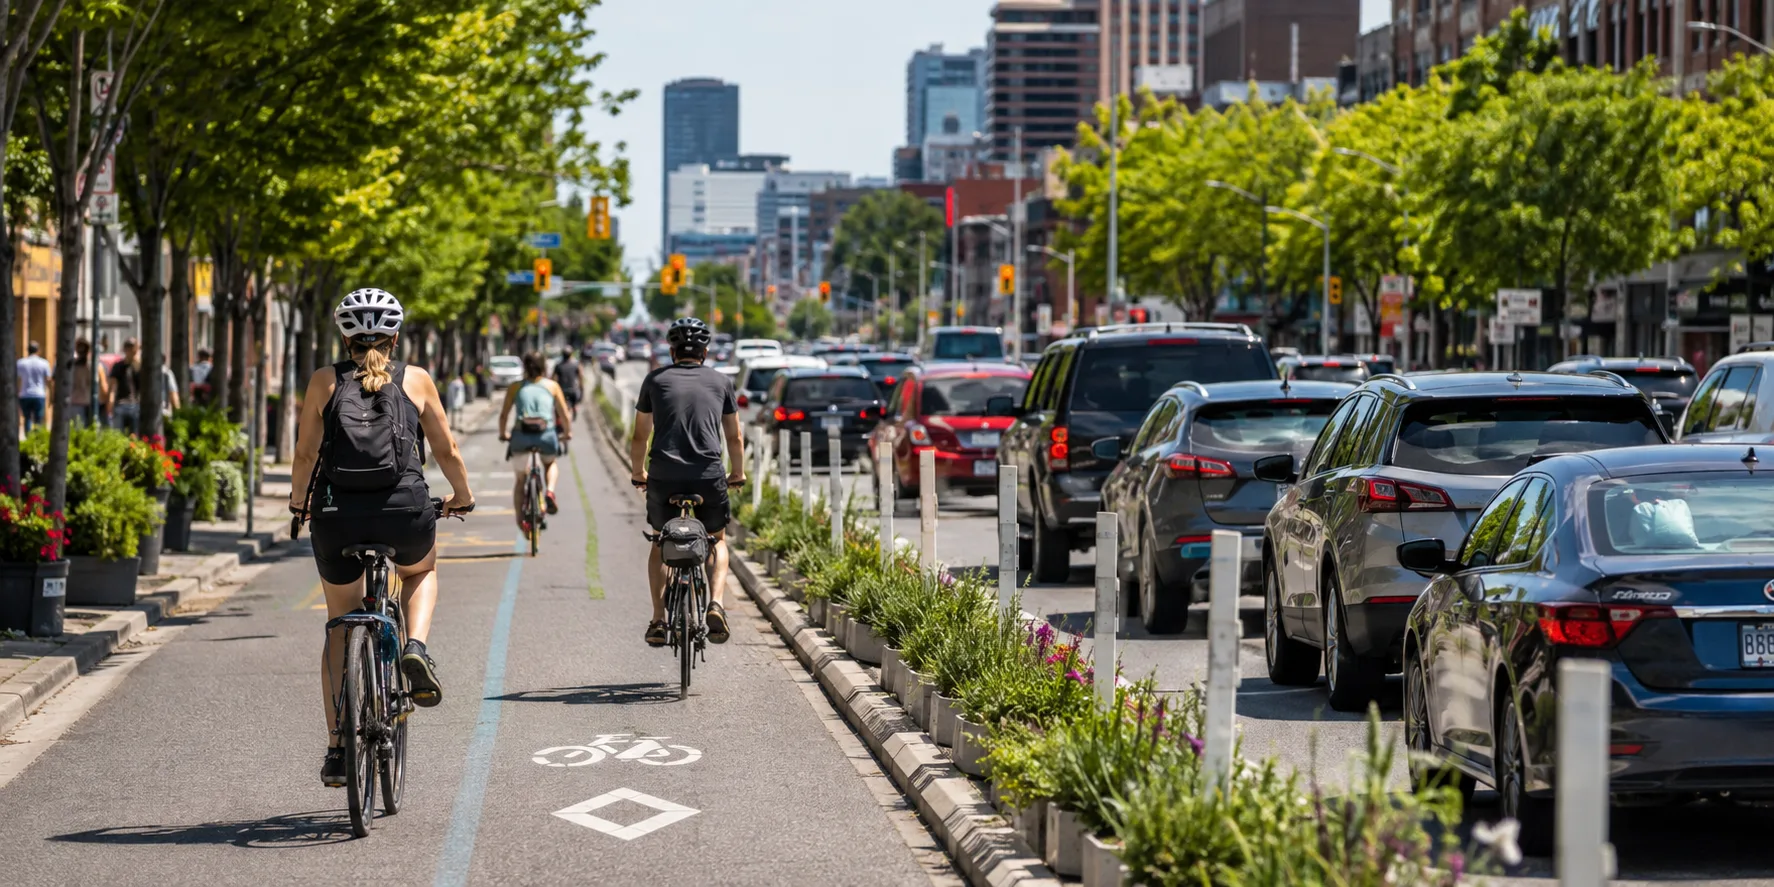
The Court of Appeal for Ontario cleared the province to remove roughly 19 kilometres of protected bike lanes on Bloor, Yonge and University. That answers the legal question, not the traffic one. Toronto’s permanent counters record 5,579 cyclists on a summer day at the busiest Bloor location, against about 8,754 motor vehicles, so if even 15% of those riders start driving the corridor gains 837 cars a day. An extra general traffic lane genuinely does help, worth something like 290,000 driver-hours a year at a road near capacity, but a 30% shift from cycling to driving costs roughly 730,000 person-hours a year before you count the congestion those new cars create for everyone else. The province’s famous 1.2% cycling figure is also the wrong denominator, since it covers the whole metropolitan area out to Vaughan and Oakville while the old City of Toronto is at least 5% and University-Rosedale is around 8.3%. Toronto already has the counters. Measure the street before the change and after it.
The Ontario government won its bike-lane fight in court today.
The Court of Appeal for Ontario has cleared the province to move ahead with its plan affecting roughly 19 kilometres of protected bike lanes on Bloor Street, Yonge Street and University Avenue, reversing the lower-court ruling that had blocked the removals.
That settles an important legal question.
It does not settle the traffic question.
The Ford government has consistently presented removing these bike lanes as a way to fight congestion. Transportation Minister Prabmeet Sarkaria has argued that restoring vehicle lanes will get Toronto moving again, and the province’s legislation specifically targets Bloor, University/Avenue and Yonge.
Technically, the legislation requires the minister to restore motor-vehicle lanes by reconfiguring bicycle lanes on those corridors, with regulations able to modify those requirements.1
But Toronto now has something that makes this debate a lot less theoretical than it was a decade ago.
Actual traffic data.
So instead of asking whether Toronto generally has “too many” or “too few” cyclists, we can ask a much more useful question. How many people actually use the streets where Ontario wants to remove the lanes, and what happens to traffic if some of them start driving?
More than 5,500 cyclists a day at one point on Bloor
Toraffic.ca collects data from Toronto’s permanent bicycle counters.
On the sections of the affected corridors where permanent counters exist, the busiest locations currently record:
| Corridor | Busiest permanent counter | Riders/day, annual | Riders/day, summer |
|---|---|---|---|
| Bloor | Bloor St W, west of Huron St | 3,699 | 5,579 |
| Yonge | Yonge St, north of Macpherson Ave | 1,637 | 2,132 |
| University | No permanent counter | — | — |
These aren’t estimates of the number of cyclists using the entire corridor.
They’re screenline counts: the number of bicycles crossing one location, in both directions.
That distinction matters. We’re deliberately not adding multiple counters together and potentially counting the same cyclist twice.
It also means the actual number of cycling trips touching Bloor is higher than 5,579.
More than 5,500 bicycle movements per summer day pass a single point on Bloor Street. That’s not a rounding error in Toronto’s transportation system.
And we now know how many cars Bloor carries
This is where the numbers get interesting.
City of Toronto midblock counts show the relevant section of Bloor carrying approximately 8,754 motor vehicles per day, in both directions.
That means the number of cyclists passing our busiest counter on a summer day is equivalent to almost 64% of the number of motor vehicles passing through the comparable corridor.
That’s not a modal-share calculation. Bicycles and vehicles aren’t necessarily measured at precisely the same location or under identical conditions. But it gives a sense of the scale we’re talking about.
Thousands of people are already moving through this corridor without putting another car into its traffic lanes.
So what happens if the protected lane disappears and some of them start driving?
What if just 15% of Bloor’s cyclists switch to cars?
Nobody knows exactly how cyclists will respond to removing protected infrastructure.
Some will keep cycling. Some will walk. Some will take transit. Some may change destinations or just not make the trip. And some will drive.
So rather than pretend we know the answer, Toraffic models three scenarios.
Take the 5,579 cyclists passing the busiest Bloor counter on an average summer day.
| Cyclists shifting to cars | Added cars/day | Increase in traffic | Longer peak trip |
|---|---|---|---|
| 15% | 837 | +10% | +4% |
| 30% | 1,674 | +19% | +9% |
| 50% | 2,790 | +32% | +18% |
Even the lowest scenario matters. If just 15% of those cyclists switch to driving, that’s another 837 cars per day, almost a 10% increase over the corridor’s existing measured vehicle volume. At 30%, automobile traffic rises roughly 19%. At 50%, it’s nearly a third more cars.
Why 19% more cars doesn’t mean 19% longer trips
There’s another important correction to some of the more dramatic numbers that get thrown around in congestion debates.
Congestion isn’t linear, but neither should we confuse increased delay with increased total travel time.
Toraffic uses the standard Bureau of Public Roads travel-time curve and assumes a busy peak period where the road is operating at about 90% of capacity.
Under those assumptions, a 30% shift from cycling to driving would increase total peak-period trip time by approximately 9%. A 50% shift produces an increase of about 18%.
Those are much more useful numbers than saying delay alone might increase by 40%, 50% or 70%, because total trip time is what a driver actually experiences.
Two caveats are worth adding. First, off-peak effects would be much smaller. Adding cars to a road with spare capacity doesn’t suddenly create gridlock. Second, these figures assume drivers don’t adapt. In reality, people change departure times, choose different routes, take transit or abandon trips when congestion gets bad enough. So treat these percentages as upper bounds, not predictions.
But there’s another side to the equation
Here’s something that’s often missing from arguments against the province’s plan: giving cars another lane really can reduce congestion.
Pretending otherwise would be just as misleading as pretending thousands of displaced cyclists have no effect on traffic.
If removing a separated bike lane converts that space into a functioning general traffic lane, the road has more automobile capacity. Toraffic modelled that benefit too.
Across Toronto’s approximately 110 km of on-street cycle tracks, under a scenario where a road widens from two general lanes to three, the estimated benefit depends heavily on how congested the road already is:
| Peak congestion | Driver delay saved/year | Value of time saved/year |
|---|---|---|
| Busy, 75% of capacity | ~140,000 hours | ~$2.6 million |
| Near capacity, 90% | ~290,000 hours | ~$5.4 million |
| Over capacity, 105% | ~540,000 hours | ~$9.9 million |
That’s a real benefit. The more congested the road is today, the more valuable another lane becomes.
And the lane configuration matters a lot here. Bloor and Yonge are often effectively one general-purpose lane in each direction beside the cycle track. Restoring a second lane there could produce a larger capacity benefit than a simplistic two-to-three-lane model suggests. We don’t have sufficiently detailed lane data for every corridor to pretend otherwise.
So there is a legitimate traffic argument for removal. The question is whether that benefit survives what happens next.
The problem is that cyclists don’t disappear
Across Toronto’s counted cycling network, the city’s 43 permanent counters record approximately 19,929 cycling trips on an average day. Those counters cover a network of approximately 839 kilometres and 1,581 mapped cycling segments.
Again, nobody should assume every cyclist suddenly starts driving if infrastructure disappears. So Toraffic models the same 15%, 30% and 50% scenarios across the counted network:
| Shift to cars | Added car trips/day | Added person-hours/year | Estimated cost/year | Local traffic increase | Longer peak trip |
|---|---|---|---|---|---|
| 15% | ~3,000 | ~360,000 | ~$6.7M | +7% | +3% |
| 30% | ~6,000 | ~730,000 | ~$13M | +13% | +6% |
| 50% | ~10,000 | ~1.2M | ~$22M | +22% | +11% |
These numbers aren’t directly comparable with the lane-capacity calculation above. The scopes are different. The lane benefit applies specifically to on-street cycle tracks where removing infrastructure could actually create road capacity. The displacement calculation covers cyclists across the counted network and estimates the additional travel time experienced by people who switch modes, and it doesn’t include the congestion those new cars impose on everyone else already driving.
That’s why Toraffic deliberately doesn’t subtract one number from the other and declare a winner. Doing that would create false precision.
But the direction is interesting.
290,000 hours saved versus 730,000 hours added
Look at the middle scenario.
At a road operating near 90% of capacity, reclaiming lanes could save existing drivers on the order of 290,000 person-hours per year.
Meanwhile, if 30% of affected cycling trips became car trips, the people switching modes could incur approximately 730,000 additional person-hours per year. And that second number counts only the additional travel time experienced by the people who switched. It does not include the congestion those additional cars impose on existing drivers.
That isn’t proof that every bike lane improves traffic. But it does expose the fundamental problem with the province’s congestion argument: road space isn’t the only variable. Travel behaviour matters too.
Adding automobile capacity can reduce congestion. Turning people who currently aren’t driving into drivers increases it. You have to model both.
Then there’s the famous 1.2%
The Ford government’s most memorable statistic in this debate has been that only 1.2% of people commute by bicycle.
There’s a problem with using that number to decide what happens on Bloor, Yonge and University. It’s the wrong denominator.
The 1.2% figure represents cycling’s commute share across the Toronto Census Metropolitan Area, a region extending far beyond downtown Toronto into communities such as Vaughan, Richmond Hill and Oakville.
Cycling rates change dramatically depending on where you draw the boundary.
Across the entire metropolitan area, roughly 1.2%. In the old City of Toronto, the pre-amalgamation urban core where these lanes actually exist, cycling represents at least 5% of commuting. In University–Rosedale, which contains portions of the targeted corridors, it’s approximately 8.3%.
During legislative committee hearings on Bill 212, Toronto transportation staff similarly told MPPs that newer data showed cycling represented about 6% of work trips city-wide and roughly 10% of trips into downtown, with substantially higher shares in wards containing the targeted infrastructure.2
The point isn’t that 8.3% is the “correct” number and 1.2% is wrong. The gradient is the point. The province is using the low end of that geographic range to justify changing streets located at its high end.
Even those numbers understate total cycling because census commuting data measures how people primarily get to work. It doesn’t count the person who drives to work but cycles to dinner. Or rides to school. Or goes shopping. Or meets a friend.
The physical counters do. And on Bloor, they count more than 5,500 cyclists on a typical summer day.
Measure the street you’re changing
There’s a broader lesson here that goes beyond bike lanes.
Transportation infrastructure is intensely local.
We wouldn’t decide how many subway trains to run through Bloor-Yonge station by calculating average transit use across the Greater Toronto Area. We wouldn’t decide how many lanes the Gardiner needs based on the percentage of Ontarians who commute on it. And we shouldn’t decide how Bloor Street should work based on the percentage of residents across an enormous metropolitan region who list cycling as their primary commute mode.
Measure the street you’re changing.
On Bloor and Yonge, we can. The counters tell us thousands of cyclists use them every day.
The court decision doesn’t answer the traffic question
Today’s Court of Appeal decision is important, but it’s worth being precise about what the court decided.
The legal challenge centred on whether the province’s legislation and removal of physical protection for cyclists violated Charter rights. The lower court concluded that it did. The Court of Appeal disagreed.
Ontario has therefore cleared the legal obstacle that prevented it from proceeding. It does not mean the court concluded that removing the lanes will reduce congestion. Those are completely different questions, and the second one can be measured.
In fact, Ontario may be about to run one of Toronto’s largest real-world transportation experiments. The province is changing infrastructure used by thousands of people every day, specifically on the promise that doing so will reduce automobile congestion.
So let’s measure it.
Record vehicle volumes. Record cycling volumes. Record travel times. Record peak-period congestion. Then measure exactly the same things after the lanes are changed.
Maybe the province is right. Maybe the extra automobile capacity overwhelms the effect of cyclists changing modes and traffic gets significantly better.
But our current numbers suggest something else is entirely plausible. Ontario could spend millions removing bike lanes in the name of reducing congestion, only to discover it created thousands of new car trips in the process.
We don’t need to settle that argument with ideology.
Toronto already has the counters. Let’s use them.
Frequently Asked Questions
What did the Court of Appeal actually decide?
That removing the protected lanes on Bloor, Yonge and University does not violate Charter rights, which reverses the Superior Court ruling from July 2025 that had blocked the plan. The court did not decide whether the removals will reduce congestion. It answered a constitutional question, not a transportation one, and those are genuinely separate things.
How many cyclists actually use these streets?
The busiest permanent counter on Bloor, west of Huron, records 3,699 riders on an average day across the year and 5,579 on an average summer day. On Yonge, north of Macpherson, it’s 1,637 and 2,132. University has no permanent counter. These are screenline counts, meaning bicycles crossing a single point in both directions, so the number of cycling trips touching the whole corridor is higher than the counter shows.
How much would traffic increase if cyclists started driving?
On Bloor, a 15% shift adds 837 cars a day, 30% adds 1,674 and 50% adds 2,790, against roughly 8,754 vehicles a day already using the corridor. That works out to 10%, 19% and 32% more cars. Longer trips don’t scale the same way: using the Bureau of Public Roads curve at 90% of capacity, those same scenarios lengthen a peak trip by about 4%, 9% and 18%. Treat those as upper bounds, since drivers shift departure times, reroute or skip trips, and off-peak effects are much smaller.
Doesn’t adding a traffic lane reduce congestion?
Yes, and pretending otherwise would be just as misleading as pretending displaced cyclists don’t affect traffic. Across Toronto’s roughly 110 km of on-street cycle tracks, going from two general lanes to three could save drivers around 140,000 hours a year on a road at 75% of capacity, 290,000 hours at 90%, and 540,000 hours at 105%. The catch is the other side of the ledger: a 30% network-wide shift from cycling to driving adds roughly 730,000 person-hours a year for the people who switched, before counting the congestion their cars create for everyone already on the road.
Is only 1.2% of Toronto commuting by bike?
Not in the places these lanes exist. The 1.2% is the commute share for the entire Toronto Census Metropolitan Area, which stretches out to Vaughan, Richmond Hill and Oakville. In the old City of Toronto the figure is at least 5%, and in University-Rosedale it’s around 8.3%. City staff told the Bill 212 committee hearings in November 2024 that cycling was about 6% of work trips city-wide and about 10% of trips into downtown. Census commuting data also only captures how people primarily get to work, so it misses every trip to school, dinner or the shops.
Footnotes
- Ontario’s legislation requires the Minister of Transportation to restore motor-vehicle lanes by reconfiguring bicycle lanes on specified portions of Bloor Street, University Avenue/Avenue Road and Yonge Street, subject to modifications that can be made by regulation. See Ontario’s Highway Traffic Act provisions enacted through Bill 212 and subsequent amendments. ↩
- During the Ontario Legislature’s November 18, 2024 committee hearings on Bill 212, City of Toronto transportation staff told the committee that cycling accounted for approximately 6% of work trips across Toronto and approximately 10% of trips into downtown, with considerably higher cycling mode shares in some of the wards directly affected by the proposed removals. This is a substantially different picture from the 1.2% Toronto-CMA figure repeatedly cited in support of the provincial policy. ↩