Canadian mobile prices fell 39% from 2020 to 2024, then rose 13% by 2025, and the three biggest carriers advertise the same flagship price in Ontario. Quebecor, which took over Freedom Mobile on condition it cut prices, now proposes to buy TELUS. A combined company would hold about 38.6% of mobile subscriptions and cross all three Competition Act merger thresholds nationally. The evidence can’t yet settle the outcome.
The company that took over Freedom Mobile on condition that it cut prices now proposes to combine with one of the three biggest. Here's what the evidence shows.
Figures as of November 19, 2026.
- Prices fell
- -39%
- Average monthly price of a mid-size mobile plan, 2020 to 2024
- The rebound
- +13%
- Back up to $73.51 a month by 2025
- If combined
- 38.6%
- TELUS and Quebecor's share of mobile subscriptions, more than any other group
The advertised price of a typical Canadian mobile plan fell four years in a row. For a plan with unlimited nationwide talk and text along with 20+ GB of data, the national average dropped from $107.08 a month in 2020 to $65.04 in 2024, according to the federal government's annual price study, which flags its earlier years as less certain.
Then it turned. By 2025, the average was back up to $73.51, 13% above the low.
Near the end of that slide, in 2023, Ottawa let Quebecor's Vidéotron take over Freedom Mobile, on conditions that included lower prices.
On November 16, 2026, Quebecor went public with a proposal to buy TELUS, one of the three biggest alongside Bell and Rogers.
Would a combined company keep prices down, or would Canadians lose a lower-priced competitor? The evidence can't settle that yet. Here's what it does show: what the companies charge, how prices have moved, what a combination would change, who paid for the networks, and what we still don't know.
Subscribers and prices
Three companies, one price
Four groups serve almost all of Canada's mobile customers. TELUS has about 26.8% of mobile subscriptions; Quebecor, the smallest of the four, has about 11.9%.
Show the numbers
| Group | Share |
|---|---|
| Rogers | 31.6% |
| Bell (BCE) | 26.8% |
| TELUS | 26.8% |
| Quebecor (Vidéotron, Freedom) | 11.9% |
85.1% held by Rogers, Bell and TELUS combined
These shares come from each company's own subscriber count at September 30, 2026. The companies count subscriptions differently, and smaller carriers don't report theirs, so I assume carriers outside the big four hold 3% of the market. Further down, I test how much that assumption matters.
Their market shares differ. Their advertised prices, for the most part, don't.
The federal study averages every provider's plans, so it can't say which company charges what. To fill that gap, I recorded each brand's advertised price for the same plan size from its public plan pages. These are advertised prices for one line on your own phone, before tax. They aren't the same measure as the study's averages, and they aren't what customers end up paying.
Flagship pricing: matched to the dollar
Bell (BCE)
- Bell$70promotion
- Virgin Plus$45promotion
- Lucky Mobile$35
Rogers
- Rogers$70
- Fido$45
- chatr$35
TELUS
- TELUS$70
- Koodo$45promotion
- Public Mobile$30
Quebecor
- Freedom Mobile$40
- Fizz$29
Show the numbers
| Brand | Advertised price |
|---|---|
| Bell | $70 (promotion) |
| Virgin Plus | $45 (promotion) |
| Lucky Mobile | $35 |
| Rogers | $70 |
| Fido | $45 |
| chatr | $35 |
| TELUS | $70 |
| Koodo | $45 (promotion) |
| Public Mobile | $30 |
| Freedom Mobile | $40 |
| Fizz | $29 |
In Ontario, advertised prices for this plan size run from $29 (Fizz) to $70 (Bell, Rogers and TELUS), a gap of $41. The flagship brands (Bell, Rogers and TELUS) advertise the same price.
Identical flagship prices have more than one possible explanation: rivals matching each other, similar costs, or tacit coordination. Advertised prices alone can't tell these apart, and I'm not claiming any one of them. Meanwhile the cheaper brands, several of them owned by the same companies, advertise lower prices at the same plan level.
The price story
The fourth carrier
Industry Minister François-Philippe Champagne approved the transfer of Freedom Mobile's licences to Videotron subject to binding conditions, including prices at least 20% lower, no transfer of Freedom's licences for ten years, 5G expansion within two years and up to $200 million in damages for non-compliance. He also announced a moratorium on large-scale spectrum transfers and a review of the transfer framework.
- Canada
- Quebec
Average monthly price by year
| Year | Canada | Quebec |
|---|---|---|
| 2020 | $107.08 | $101.83 |
| 2021 | $98.65 | $86.27 |
| 2022 | $87.28 | $78.82 |
| 2023 | $67.18 | $60.91 |
| 2024 | $65.04 | $58.60 |
| 2025 | $73.51 | $65.16 |
The same study tracks prices back to 2020. For this plan, the Canadian average fell 39% to a low of $65.04 in 2024, then rose 13% to $73.51 in 2025.
Quebec, home to 63% of the area where ISED lists Quebecor's mobile service, had the lowest average of any province in every year of the series.
Treat the early years with care. The study's authors converted the 2020 to 2023 prices to today's plan definitions and say they couldn't validate those figures. The data also can't say why prices changed: the Freedom Mobile sale and other shifts in the market happened over the same period.
How Canada compares
For a mid-size mobile plan, Canada is the 2nd most expensive of the 8 countries in the federal government's 2025 price study.
Show the numbers
| Country | Average price |
|---|---|
| Japan | $91 |
| Canada | $74 |
| United States | $61 |
| Australia | $34 |
| Germany | $25 |
| United Kingdom | $19 |
| Italy | $17 |
| France | $14 |
The chart shows level 3 of 6 plan sizes in the study: Unlimited nationwide talk and text along with 20+ GB of data. Prices are average monthly costs in Canadian dollars, including taxes; other countries are converted at purchasing-power rates.
Canada is the most or second most expensive at every mobile plan size the study compares.
Within Canada, Quebec has the lowest average mobile price of the 8 regions at levels 2, 3, 4 and 5.
The study averages every provider's advertised plans. It doesn't show which companies' prices produce these differences, or why.
Why does this matter for a merger? Competition law watches concentration because fewer competitors usually means less pressure on prices. The study can't show whether concentration is what drives Canada's prices, and I'm not claiming it does.
Prices on this page are reproduced from “Price Comparisons of Wireline, Wireless, and Internet Services in Canada and with Foreign Jurisdictions: 2025 Edition”, by Global Advantage Consulting Group (GACG), in partnership with Networks, Economics and Strategy (NE&S), for Innovation, Science and Economic Development Canada. This is a copy of the version available at https://ised-isde.canada.ca/site/strategic-policy-sector/en/telecommunications-policy/price-comparisons-wireline-wireless-and-internet-services-canada-and-foreign-jurisdictions-2025. The reproduction has not been produced in affiliation with, or with the endorsement of, the Government of Canada.
The offer and the law
What the deal would change
Quebecor, which owns Vidéotron and Freedom Mobile, has proposed combining with TELUS by buying its shares.
Where it stands: Unsolicited, non-binding, conditional proposal. Not a take-over bid and not an agreed transaction. TELUS's Special Committee has made no determination.
What the Quebecor offer looks like
Below is Quebecor's own description of its offer. The figures and claims are Quebecor's, not mine.
- Consideration per TELUS share
- $6.35 cash + 0.1700 Quebecor Class B share
- As stated by Quebecor
- Implied value per TELUS share
- About $19.45 (based on Quebecor's Nov. 13, 2026 close of $77.06)
- As stated by Quebecor
- Premium
- About 60% to TELUS's Nov. 13, 2026 close of $12.14
- As stated by Quebecor
- Implied firm (enterprise) value
- $60.7 billion, including $29.7 billion of TELUS net debt; 8.3× 2027 consensus EBITDA
- As stated by Quebecor
- Claimed synergies
- About $160 million a year in operating-cost synergies and about $235 million a year in capital-spending efficiencies, with about $160 million in one-time costs over three years.
- Quebecor's claim
TELUS's response: No determination made. The Special Committee cites significant concerns about regulatory and execution risk, governance, value and leverage, and is exploring strategic alternatives.
Before and after
A combined TELUS and Quebecor would hold about 38.6% of Canadian mobile subscriptions, more than any other group.
Show the numbers
| Group | Share |
|---|---|
| Rogers | 31.6% |
| Bell (BCE) | 26.8% |
| TELUS | 26.8% |
| Quebecor (Vidéotron, Freedom) | 11.9% |
Show the numbers
| Group | Share |
|---|---|
| TELUS + Quebecor | 38.6% |
| Rogers | 31.6% |
| Bell (BCE) | 26.8% |
The regulatory tripping points
Competition authorities measure how concentrated a market is with a score called the HHI: square each company's market share and add them up. Four equal companies score 2,500; a single company scores 10,000. The higher the score, the fewer and bigger the players.
Nationally, the score would rise by about 635 points, from 2,572 to 3,207.
Under Canada's Competition Act, a merger is presumed to substantially lessen competition if it raises the score by more than 100 points and either the score ends above 1,800 or the combined company holds more than 30% of the market. The companies can try to rebut that presumption. Nationally:
- crossed+635 pointsThe score rises by more than 100 points
- crossed3,207The score ends above 1,800
- crossed38.6%The combined company has more than 30% of the market
All three lines are crossed under every assumption I tested for the share held by smaller carriers (0% to 8% of the market), so the presumption would apply nationally.
That's the national picture. A regulator may look at provinces or cities instead, and provincial shares that include Freedom Mobile aren't published (more on that in the last section).
Where they overlap
On mobile, they overlap almost everywhere Quebecor offers service. On home internet, they overlap only in Quebec, and in 113 areas TELUS and Vidéotron are the only two wired providers.
I used the federal government's broadband map, which divides Canada into hexagons of about 25 km². The counts below measure area, not people.
TELUS and Quebecor (Vidéotron and Freedom Mobile) both list mobile service in 5,931 hexagons. Today 10,573 hexagons have four or more mobile provider groups; after a combination, 5,066 would.
For wired home internet (fibre, cable or DSL), both list service in 182 hexagons. In 113 of them no other wired provider is listed, so a combination would leave just one.
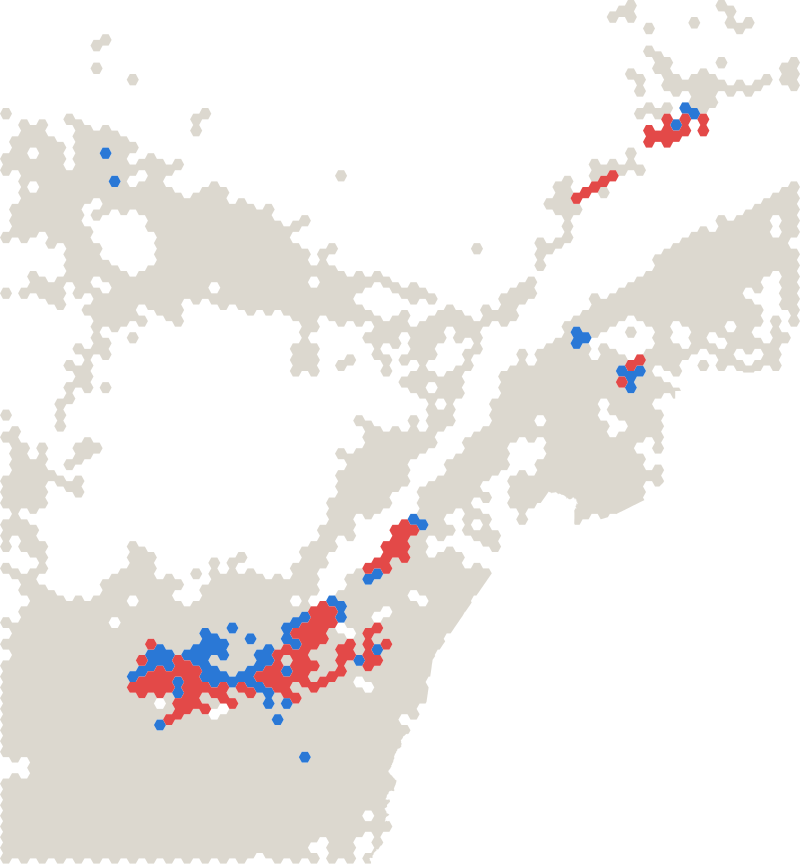
- Only TELUS and Vidéotron (113)
- Both, with other wired providers (69)
- Other areas with homes
Each hexagon is about 25 km². The map shows the area around the overlap, not all of Quebec.
Public money
Who paid for the networks
Of the 113 areas where TELUS and Vidéotron are the only wired providers, 93 fall within the footprint of at least one public broadband program.
In 43 of those areas, the federal broadband map names a project for TELUS.
- TELUS federal funding
- $322.8M
- In 48 agreements since 2009
- Quebecor federal funding
- $7.8M
- In 6 agreements since 2009
Show the numbers
| Carrier | Federal commitment |
|---|---|
| TELUS | $322.8M |
| Bell | $228.2M |
| Rogers | $158.5M |
| Quebecor (Vidéotron, Freedom) | $7.8M |
These are the federal contributions committed in each agreement, not money spent. They're grouped by the company name on the agreement: a company later bought by another carrier isn't added to its buyer, and companies listed under other names, such as Northwestel, aren't added to any carrier.
Federal Universal Broadband Fund agreements with the Government of Québec itself total $466.8M. Under Quebec's own programs, Régions branchées and Volet Éclair, Vidéotron was granted $257.7M to connect 37,335 homes and TELUS $26.1M for 4,723 homes.
Figures quoted from “Nombre de foyers à desservir par chaque fournisseur de services Internet et montant de la subvention octroyée en millions de dollars par l’entremise des programmes Régions branchées (RB) et Volet Éclair (VE)”, Gouvernement du Québec, https://cdn-contenu.quebec.ca/cdn-contenu/adm/org/secretariat-internet-haute-vitesse/operation-haute-vitesse/Tableau_fournisseurs_de_services_Internet.pdf (PDF created March 19, 2021; retrieved November 17, 2026). The Government of Québec does not permit reproduction of its documents without authorization, so I quote these figures for news reporting rather than reproducing the table.
Still to come
What happens next, and what we still don't know
A combination would need several approvals, including from federal regulators, and important facts are still not public.
Approvals required, as listed by Quebecor: Definitive agreements, binding financing, both boards, securityholder and court approval, and approval by the Competition Bureau, the CRTC and ISED (spectrum licence transfers).
Divestitures, as proposed by Quebecor: None. Quebecor proposes keeping Freedom Mobile as a lower-cost flanker brand and deploying Freedom's spectrum across TELUS's network.
Regulators can require conditions or the sale of parts of the business, which would change every projection in this story.
Coming up
- November 23, 2026: Scheduled: TELUS and Quebecor executives to meet
What the evidence cannot tell you yet
- Why mobile prices fell for four years and then rose. ISED's study reports average prices by year but not their causes; the Freedom Mobile sale and other changes in the market overlap in time, and the study's 2020 to 2023 figures were remapped and could not be validated by its authors
- Provincial mobile shares including Freedom. CRTC Figure 5 excludes Freedom and Eastlink from its provincial shares; companies do not report subscribers by province
- Fixed broadband speeds actually delivered and prices. NBD records advertised availability by technology, not measured speed. Advertised prices by region now come from ISED's price study, but not prices actually paid or measured speeds
- Funding amounts by project and place. Federal amounts now come from the Grants and Contributions disclosure (open licence), by program and recipient. Its agreement numbers are ISED's internal ones and do not match the project numbers in the National Broadband Data footprints, so amounts cannot be placed on the map or matched to a hexagon. The UBF project page lists amounts by project number but is HTML under canada.ca terms
Sources
How this was made: every number in this article comes from public sources, listed above by section. Some figures come straight from a source, some I calculated from that data, and some, marked “if combined”, are projections under stated assumptions. Company figures and claims are attributed to the company. This article doesn't argue for or against the transaction.
Frequently Asked Questions
What has Quebecor offered for TELUS?
Quebecor says it would pay $6.35 in cash plus 0.1700 of a Quebecor Class B share for each TELUS share, about $19.45 based on Quebecor’s November 13, 2026 close and roughly a 60% premium. It’s an unsolicited, non-binding proposal, not a takeover bid, and TELUS’s Special Committee hasn’t made a determination.
How much of Canada’s mobile market would TELUS and Quebecor hold together?
About 38.6% of mobile subscriptions, more than any other group, based on each company’s own subscriber count at September 30, 2026. TELUS has about 26.8% on its own and Quebecor about 11.9%.
Would the deal trigger the Competition Act’s merger presumption?
Nationally, yes. The HHI concentration score would rise about 635 points, from 2,572 to 3,207, and the combined company would hold more than 30% of the market. That crosses all three lines under every assumption tested for smaller carriers’ share. The companies can still try to rebut the presumption.
Have Canadian mobile prices gone down since Freedom Mobile was sold?
The federal price study shows the average for a mid-size plan fell from $107.08 a month in 2020 to $65.04 in 2024, then rose to $73.51 in 2025. It can’t say why. The Freedom Mobile sale and other market changes happened over the same period, and the study’s authors couldn’t validate the 2020 to 2023 figures.